Beneath
the surface.
Oceans, lakes, reefs — measured below the waterline.
Every line in the Deep archive is traced from NOAA Coastal Relief or GEBCO bathymetric sources. Human-edited. When you wear a trench or a reef, you wear a shape no eye has seen whole.
Your spot.
Mapped by hand.
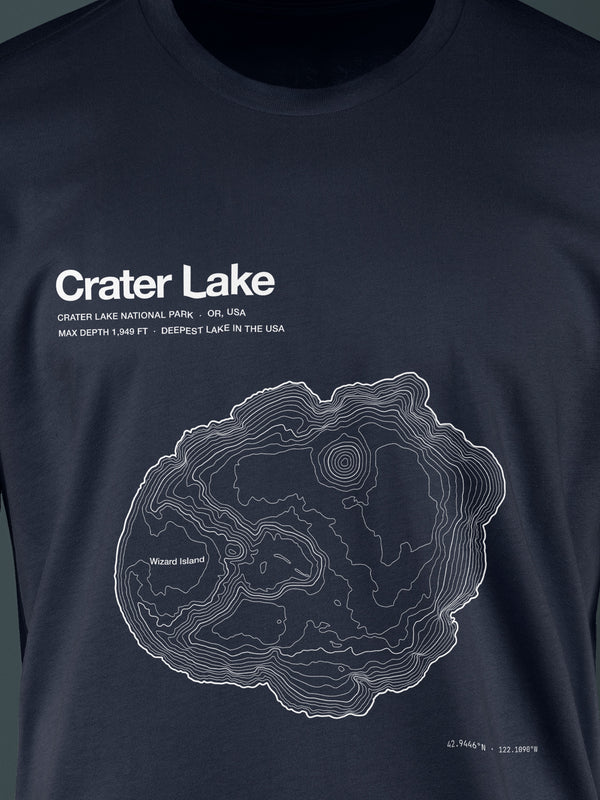
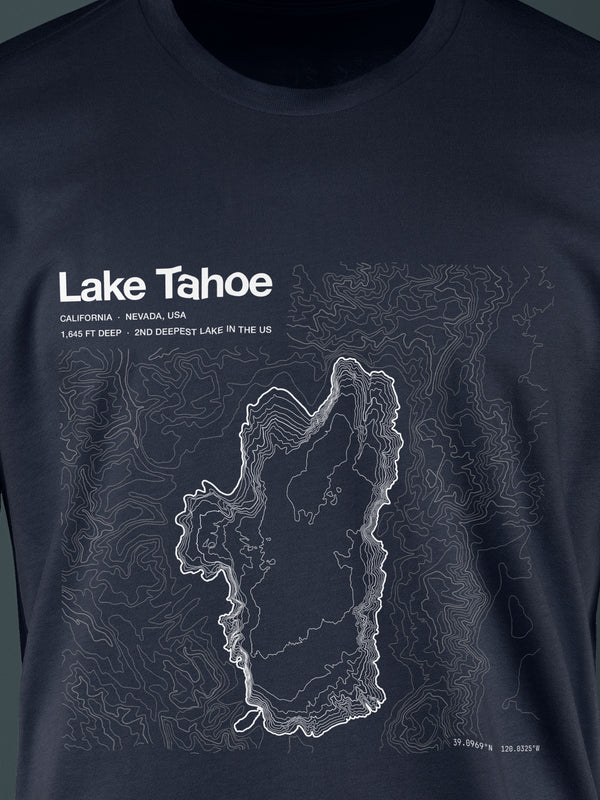
Bathymetric contours of inland waters. Every depth line is traced against NOAA or regional hydrographic surveys.
The island you see is
a fraction of what's there.
The shape above the waterline is half the story. Each entry includes the submerged terrain that holds the island in place.
 PRINT
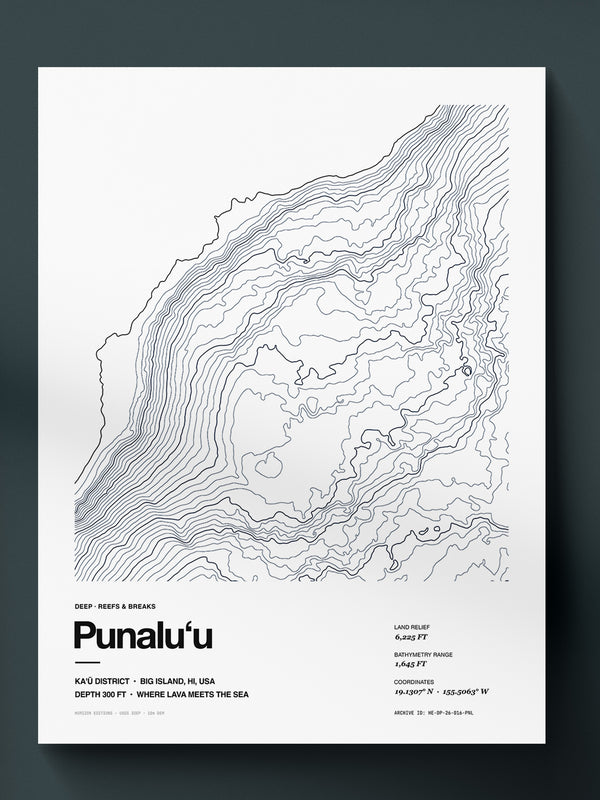
PRINTPunaluʻu
WHERE LAVA MEETS THE SEA
Basalt shattered by the sea into black sand.
 TEE
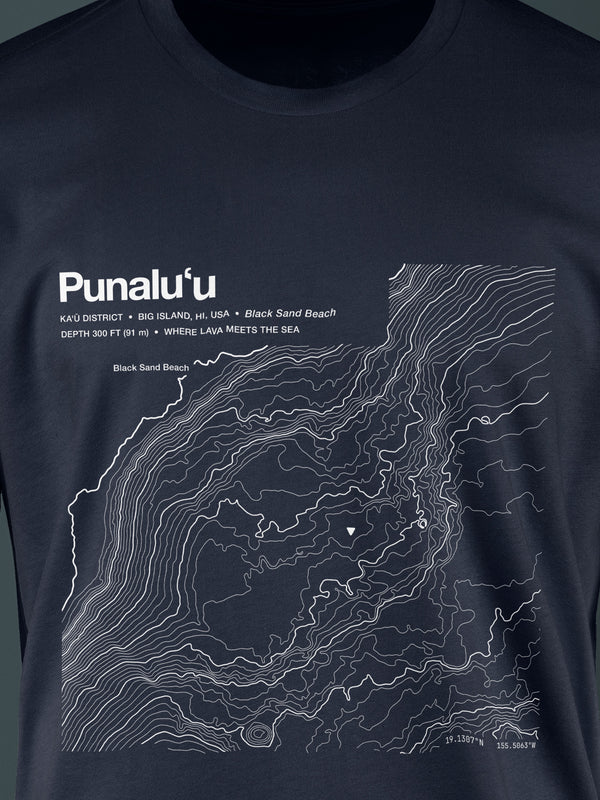
TEEPunaluʻu · Big Island
WHERE LAVA MEETS THE SEA
Basalt shattered by the sea into black sand.
 TEE
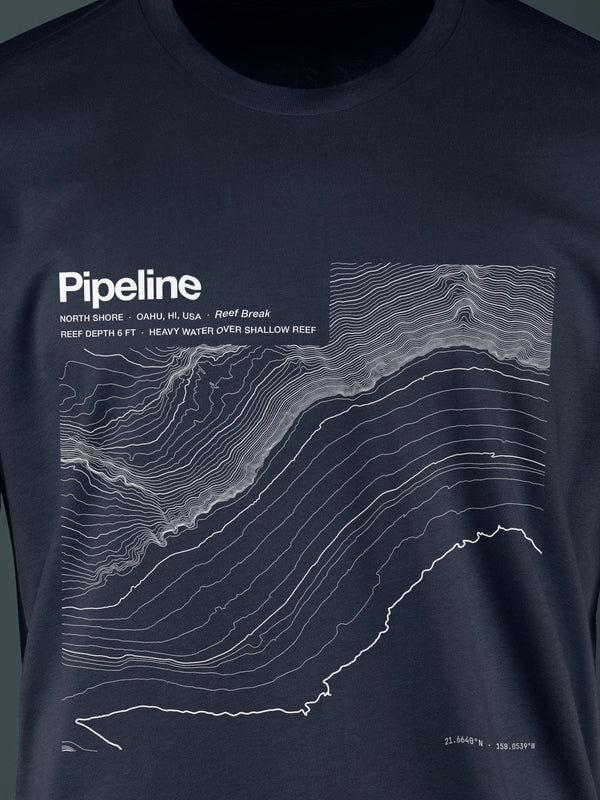
TEEPipeline · Banzai Reef
BANZAI PIPELINE · OʻAHU NORTH SHORE
Waves break over a reef 6–10 ft down that shapes the barrel.
Every island is a mountain standing in water.
The visible land is often less than 10% of the structure. Our island entries include the submerged shield — the real shape.
The break. The shelf.
The drop you've felt.
Shallow bathymetry where surf meets reef. Plotted from NOAA coastal relief and local surveys.
 PRINT
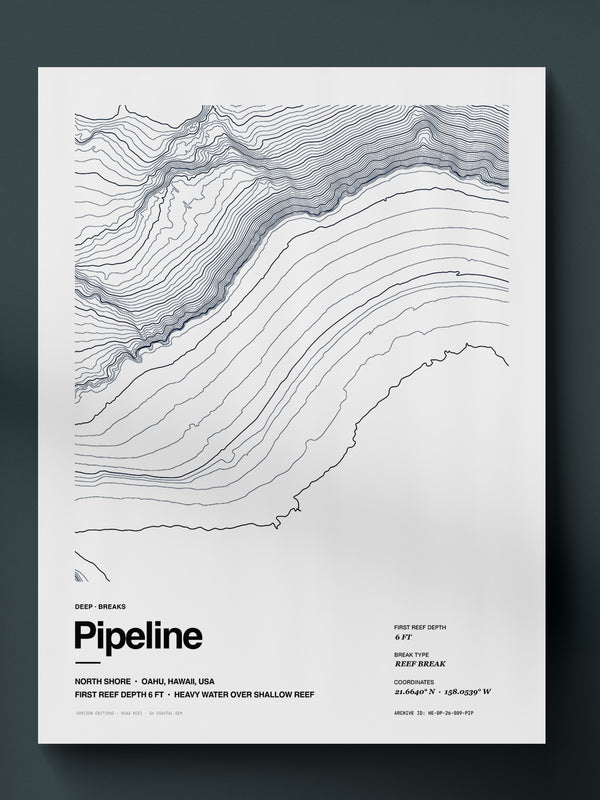
PRINTPipeline
BANZAI PIPELINE · OʻAHU NORTH SHORE
Waves break over a reef 6–10 ft down that shapes the barrel.
A break is a bathymetric accident.
Pipeline exists because the reef shallows abruptly. Geometry becomes geology, becomes sport.
Nobody goes here.
The data did.
Trenches, abyssal plains, and the structures only sonar can see. GEBCO global grid data.
 PRINT
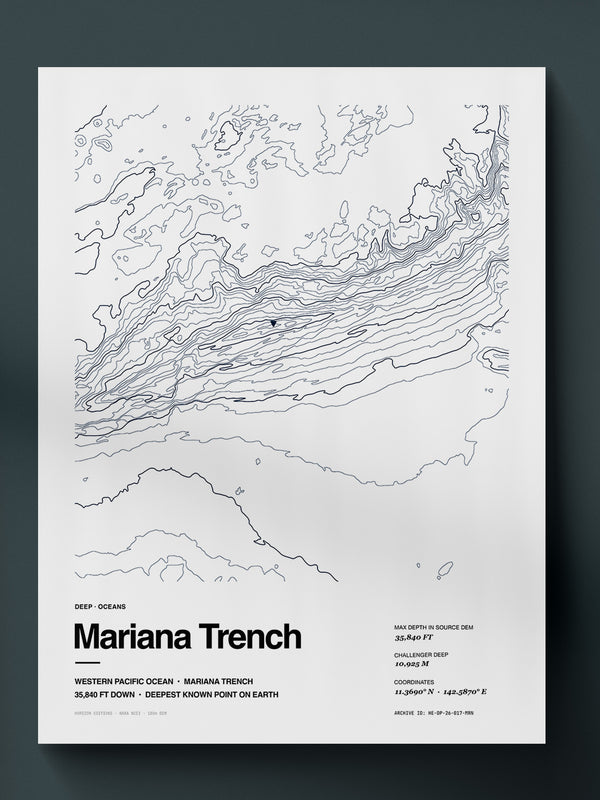
PRINTMariana Trench
8 TONS PER SQUARE INCH · CHALLENGER DEEP
Deeper than Everest is tall. Sunlight has never reached the floor.
 TEE
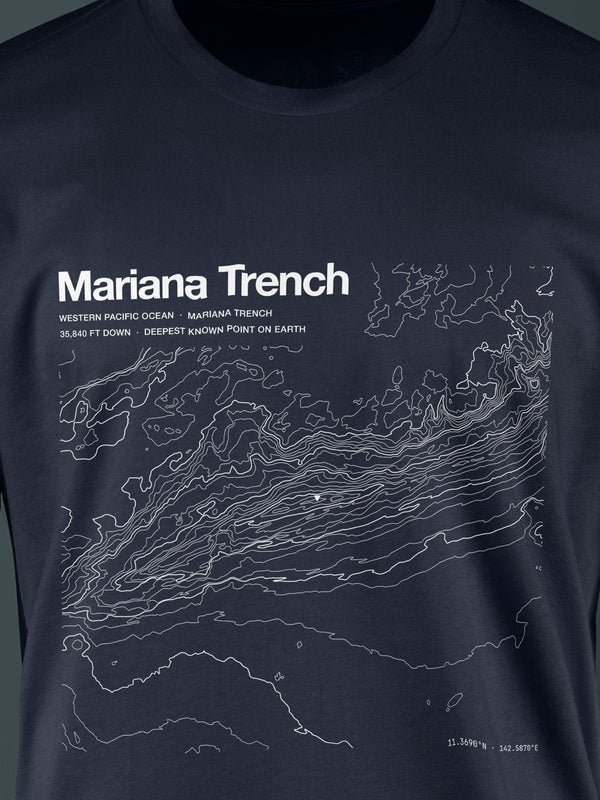
TEEMariana Trench
8 TONS PER SQUARE INCH · CHALLENGER DEEP
Deeper than Everest is tall. Sunlight has never reached the floor.
Only four have reached Challenger Deep.
Twelve people walked on the Moon. Four reached the bottom of the Mariana Trench. The data has been there the whole time.
The shape of the water,
mapped from below.
Bathymetry is underwater topography — the measurement of ocean, lake and river depths. Where topography uses GPS and aerial LiDAR, bathymetry relies on sonar: sound pulses sent down and timed on their return.
The result is a depth chart: contour lines connecting points of equal depth beneath the surface. The Deep archive starts with NOAA and GEBCO data — the same sources used by naval cartographers and marine scientists.
Other
collections.
Every world carries the same standard: real data, human-edited, made to order.
Earth.
Above the line.
Summits, volcanoes, glaciers and trails. Built from USGS 3DEP elevation data.
Enter Earth → III · SPACESpace.
Beyond this one.
Mars, the Moon and icy worlds. Built from NASA MOLA and LRO laser altimetry.
Enter Space → ◈ Complete EditionsComplete Editions.
Tee + Print.
One archive entry, two forms. The archival print for the wall, and its wearable counterpart.
Browse sets →